When planning a large-scale event, one thing becomes clear quickly: guesswork doesn’t cut it. Every decision you make, from booth layout to session timing, affects your event’s overall experience and outcome.
That’s why using data effectively is your secret weapon. Event-driven analytics transform the way you plan and manage your events, helping you create more meaningful experiences while maximizing ROI.
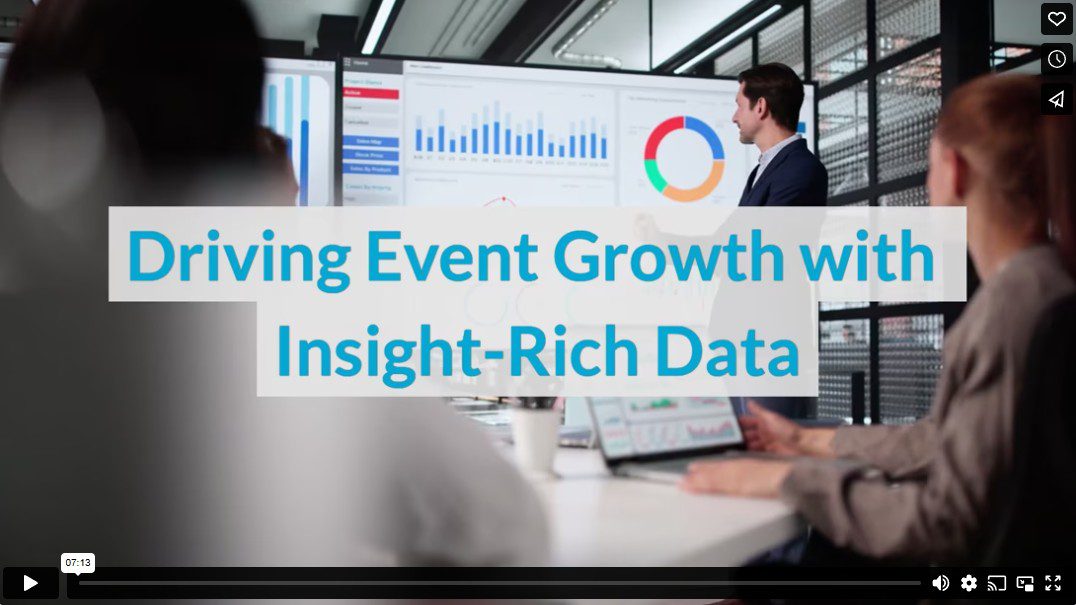
Why Data Is No Longer Optional in Event Management
You might have heard the phrase “data is the new oil.” And when it comes to large-scale events, that couldn’t be more accurate.
With thousands of attendees and multiple vendors, sponsors, sessions, and activities in play, you need more than instinct to make informed decisions. Hard data gives insight into who’s attending, what they care about, how they engage, and where your event can improve.
When you integrate data-driven thinking into your planning process, you stop reacting to problems and proactively design better events. It’s not just about solving logistical headaches anymore. It’s about turning your event into a scalable, repeatable growth engine.
Before the Event: Predict, Plan, and Prepare
Using data before your event even begins helps you tailor experiences and logistics with precision. Registration platforms, CRMs, and past event records allow you to analyze demographics and engagement behavior.
You can forecast attendance more accurately, allocate staff based on historical bottlenecks, and even personalize pre-event communication. For example, if data shows that 65% of your past attendees opted into sessions related to sustainability, you can use that insight to design new content tracks and invite relevant sponsors.
You also gain visibility into your marketing efforts. Tracking click-through rates, conversion funnels, and time on your landing page tells you what’s working and what’s not. This helps you adjust your messaging before it’s too late and focus your budget where it drives the most registrations.
Onsite: Real-Time Visibility and Decision-Making
Once your event kicks off, real-time data becomes your operational lifeline. You can monitor traffic flows using badge scans or beacons to prevent congestion and adjust room capacities on the fly. QR codes and RFID event management software help you see which booths and sessions draw the most engagement.
Let’s say your data dashboard shows a steep drop in check-ins for a highly anticipated speaker. With that kind of visibility, you can troubleshoot immediately before it snowballs into a bigger problem.
And if you’re hosting sponsors or vendors, you can deliver performance data during the event. This empowers them to tweak their messaging or booth interactions in real time, increasing satisfaction and improving their ROI.
After the Event: Analyze and Optimize for Growth
When the lights go down and your venue empties, the real value of your data becomes clear. Now you can dig into your post-event analytics and understand what worked, what didn’t, and where to focus next.
How long did people stay at different sessions? What was the bounce rate on your event landing page? Which sponsor activations had the most traffic? You can compare this data against your goals to determine success metrics like cost per lead or engagement time.
This post-event insight doesn’t just help you improve the next iteration of the same event. It also equips you to pitch stronger sponsorships, design smarter outreach campaigns, and tailor future programs to match audience demand. Instead of planning blindly, you can scale intelligently.
Making It Actionable: Types of Data You Should Be Tracking
To get the most out of your data, you need to know what to track. While every event is different, there are a few categories of data that apply to most large-scale gatherings:
- Attendee Demographics and Behavior: Registration data, session attendance, app engagement, feedback forms, and dwell times at booths
- Operational Performance Metrics: Badge printing speed, Wi-Fi usage, staffing demand by zone, entry/exit flow, and heatmap tracking
- Marketing and Sales Metrics: Email open rates, referral sources, paid ad conversions, social media mentions, and post-event lead quality
Focusing on these categories helps you generate a well-rounded picture of how your event performed and what levers to pull next time to amplify results.
Integrating Data Across Your Tech Stack
You likely use multiple tools to run your event: CRMs, marketing platforms, registration systems, onsite badge printers, and survey tools. If those platforms don’t integrate, you’re missing connections that could yield valuable insights.
For instance, connecting your CRM to your on-site check-in system lets you match attendance with sales data post-event. This shows exactly which leads engaged at the event and whether they moved down the funnel afterward. That kind of insight enables better event attribution and smarter sales follow-ups.
The ultimate goal is to unify your data. Centralized event analytics software can help bring everything together in one place, reducing silos and giving you a more accurate picture of performance.
How Data Drives Sponsorship Growth
If you rely on sponsor dollars to make your event successful, data is one of your most powerful negotiation tools. You can use attendance stats, engagement rates, and audience demographics to prove the value you deliver.
Let’s say you’re pitching a potential sponsor for next year. Imagine walking into that meeting with charts showing their competitor’s booth had a 78% higher dwell time and generated 320 qualified leads from a similar audience. That’s not just a talking point; that’s ammunition.
When you can speak in ROI terms and prove audience alignment, you shift the conversation from “should we sponsor?” to “how big should our sponsorship package be?”
The Shift from Vanity Metrics to Actionable KPIs
Not all data is created equal. Chase vanity metrics like total attendance or page views may tempt you, but those don’t always translate to growth. What you need are actionable KPIs that connect directly to your goals.
For example, if your objective is lead generation, then focus on engagement rates at specific activation points, session dwell times, and conversion rates post-event. If your goal is community building, look at returning attendees, app discussion activity, or survey feedback sentiment.
By choosing KPIs that align with your purpose, you’ll ensure that your data is more than interesting; it’s usable.
Building a Culture of Data-Driven Decision Making
To make data work for you, your entire team needs to embrace it. That means making data dashboards accessible, sharing findings openly, and using insights in every planning meeting.
When data becomes part of your daily rhythm, your events become more agile, aligned, and likely to hit their goals.
Video